Welcome to part 2 of my reporting on data from my Metadata MOOC. Today, let’s look at video viewership.
And, the raw stuff:
[table “” not found /]
Definitions of these stats from the Coursera help documentation:
- Total Streaming Views: The sum of the total number of times each video lecture has been streamed.
- Total Downloads: The sum of the total number of times each video lecture was downloaded to a student’s computer.
- Unique Videos Watched: The number of unique lecture viewings summed across students (both streaming and downloaded).
- Number of Participants: The number of (unique) students who’ve watched at least one video since the start of the class (either streaming or downloaded).
Total Downloads is an interesting number to me. First of all, once a video has been downloaded, we have no way of knowing how many times it’s watched. Could be 1,000 times, could be never. But it’s great that Coursera offers the option for videos to be downloaded in the first place, though instructors can turn that option on or off for their course. I obviously opted to have that setting on, and I’d encourage all MOOC instructors to do the same. I saw Daphne Koller give a talk at Duke last year, and she said that Coursera has had students register from every country in the world, except North Korea. Now, I figure, many of those students are going to be in areas with less-than-reliable internet service. So, it seems to me that being able to download videos to watch later is likely to be an important feature for those students.
It’s also interesting that Total Downloads overtakes Total Streaming Views in week 8. Note that while Total Streaming Views has a convex curve to it, Total Downloads is almost exactly linear. I’d expect the convexity: as the number of students plateaus (see my last post on student activity), I’d expect the number of videos watched to also plateau. But that didn’t happen with Total Downloads, and I have no good explanation for why. Anyone have thoughts on this?
Also note that Number of Participants, which I didn’t graph here, plateaus exactly as expected. In fact, it’s almost the exact same curve as Total Active Students, from the last post (only with smaller numbers), plateauing by week 3.
I wonder about the issue of partially-watched videos. I do this a lot in the MOOCs I’ve taken as a student, and I’m sure I’m not the only one: I start watching a video, then I get interrupted or I have a thought and get sidetracked, and pause or stop the video, to watch the rest later. So if I stop a video partway through, and start it again later to finish, does that count as 2 viewings? I assume it does: I’d think that pausing a video & restarting would count as 1 instance of streaming, but stopping & restarting would count as 2. But that would be slightly misleading. I wonder if there might be a way to identify where in a stopped video a user restarts, and if it’s within n seconds of the stop point, then that counts as one viewing? But that’s a real nitpick. And anyway, I wonder if the difference in the Total Streaming Views stat would be significant enough to be worth the programming effort.
As I wrote in my last post, Coursera provides a huge amount of data about the course to the instructor. One analysis that the Coursera platform does for you is to graph what they call Student Retention, but which I’d call Video Viewership: the number of students who viewed each video. Note that these numbers are still growing… not very fast, but still. The course site is still open, so even though the deadline for the last homework has passed, some folks are clearly still watching videos.
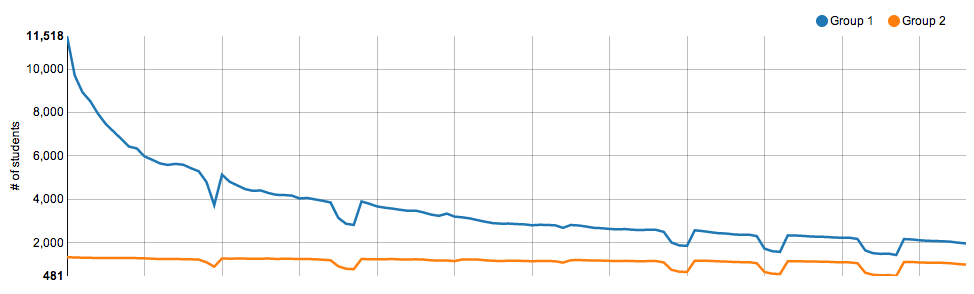
The X axis in this figure is the course videos, though there are too many to label the axis and have it still be legible. Group 1 is, I believe, Total Active Students; Group 2 is only students who completed the course.
Note the 5 very pronounced dips in this graph: those are the interviews I conducted with interesting people doing interesting things in the arena of metadata. From what I read on the discussion forums, these interviews were well received by the students. But as they’re basically supplementary to the main course, I can understand why some students skipped them. Note that even some of the students who completed the course — who, one would assume, are the most highly motivated of all who participated — even some of those students skipped the interviews.
Also note that this graph closely approximates a power law function. This is consistent with the findings from the report on Duke’s Introduction to Astronomy MOOC (see page 5). (In the interest of full disclosure, I should say 2 things here: One, the author of said report and I are married. And two, I took the IntroAstro course… and it was fantastic.) This is also consistent with practically every information-related phenomenon known to humankind. The power law shows up everywhere, so it would be a real surprise if this graph didn’t look like a power law.
Let me conclude by returning to Total Downloads overtaking Total Streaming Views in week 8. Take a look at this:
I calculated the number of new streaming views and downloads per week: just the difference between one week and the previous week. New Streaming Views peaks in week 2 and then declines steadily, just as you’d expect, given that the number of active students per week declines. But New Downloads does something completely different: it declines and then rebounds, almost to the same level in week 8 as in week 1. Also, the course is front-loaded, with more videos in the early weeks than in later weeks. So, what’s weirder is, if you normalize this for number of videos per week, downloads actually increases over the span of the course. I don’t have an explanation for this. My only hypothesis is that students who download videos (that is, probably mostly students in areas with less-than-reliable internet service) are more likely to complete the course than students who stream videos (which are who? students in developed nations with good internet access?) Anyone have any thoughts on this matter? I think this is my most interesting finding in this post, & I’d like to encourage someone to investigate this further.
Stay tuned, dear reader. Tomorrow we shall look at the discussion forums.
4 Comments
D. Rosen-Perez
I wonder if the uptick in new downloads is due to people who have been meaning to download videos for future viewing all along, and all of the sudden take action at the end of the course, because they realize the course is ending and they don’t want to lose access/the opportunity. Can you tell whether these people are downloading just the most recent video (maybe suggesting these are people with a less than optimal Internet connection simply keeping up with the course) versus all of the videos (maybe suggesting people saving the videos for consultation at some later date once the course is over)?
Alison Link
That would be my gut explanation, too. I know that, as a MOOC student with a pretty reliable Internet connection, I generally stream most of the videos online while I’m following along with the course. Somewhere in the last 1-2 weeks of the course, however, I’ll go ahead and download all of the videos to have on hand for after the course finishes. That gives me a chance to catch up on the videos I’ve missed (although I’ll admit I don’t always manage to fully catch up) and save the rest “for a rainy day”!
Data about the Metadata MOOC, Part 4: Completion | Jeffrey Pomerantz
[…] my Metadata MOOC. I’d like to delve a little deeper, do some hypothesis testing (for example, students in the developing world are more likely to complete the course than students in the first w…), or do some comparison across courses. But for the moment, descriptive stats are what I have for […]
John Swope
The reason your download curve is linear may be because students realized that downloading courses made them easier to watch on their phone or tablet.
As a MOOC student for a different course, I quickly discovered that it was much more convenient to watch a MOOC video on my iPad–which doesn’t have wi-fi–during my commute. So while in the beginning I was just discovering the course and I was at my computer, by the end I understood the convenience of downloading the videos and watching them in between other things.